Reporting: your figures always at hand

From daily closing to sell-through per brand: all your till reports, online and exportable.

Know every day how your shop is doing

More than twenty reports in your back office: from daily closing to stock value. View them online and export to Excel.

Every sale on your Onlinefact till goes straight into your reports. Nothing to retype or add up. You close the day with the Z report, see your revenue per day, VAT rate and payment method, and know which products sell and what to reorder. All reports open in the back office in your browser. You can print them or view them as PDF, and export them to Excel.

Advice

Curious what this means for your shop? Ask for free advice, or call us on +32 78 70 02 02.

Yes please!

What the reports do for you

  • Correct daily closing

    Z report per VAT rate, cannot be changed.

  • Revenue at a glance

    Monthly revenue per day, payment method and VAT rate.

  • Every receipt traceable

    Sales details with lines, payments and discounts.

  • Stock under control

    To order, stock count and sell-through per brand.

  • Excel export

    Export your reports and continue in Excel.

  • View anywhere

    The back office runs in your browser, also on the go.
All reports in one place

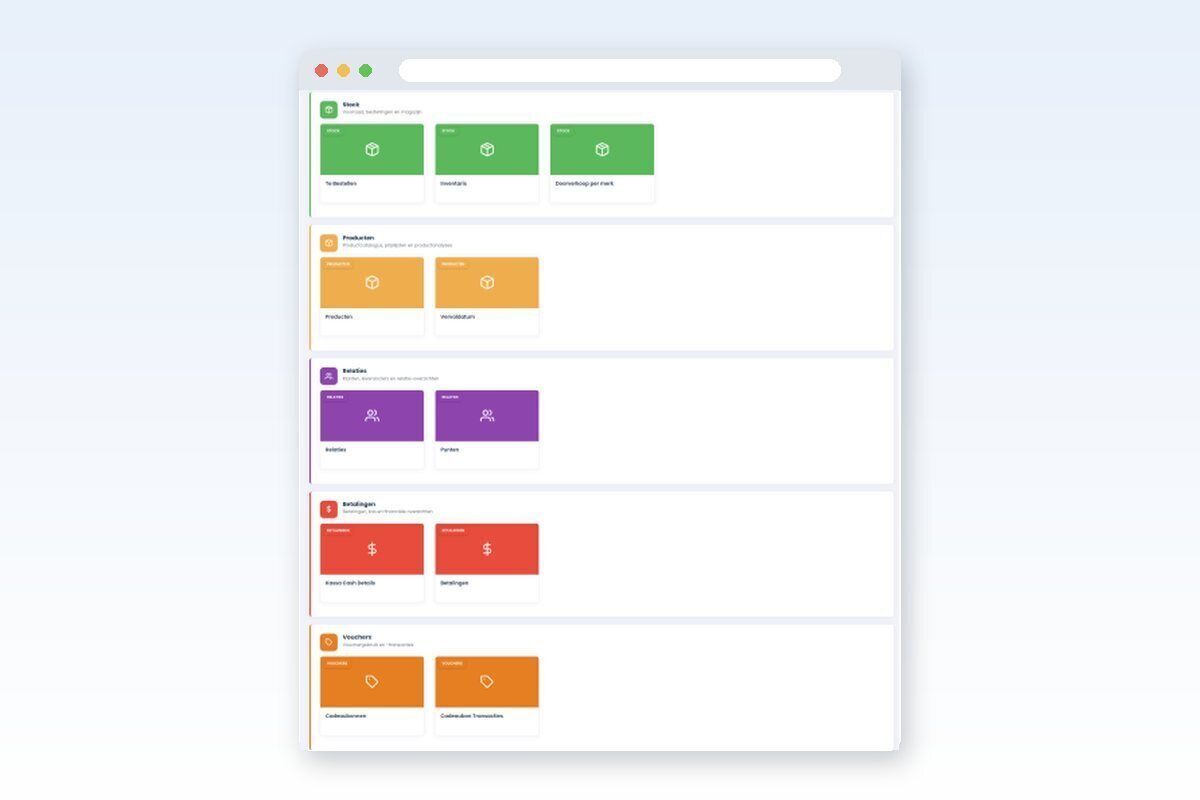
In the back office all reports are grouped under Reports: sales, documents, stock, products, payments, vouchers and till. Choose a period, filter by till, category, brand or season where needed, and the report is ready.

Real-life example: The owner of a toy shop opens the reports on his laptop every Monday: first last week's revenue, then what needs reordering.

  • Reports grouped by topic
  • Filters for period, till, category, brand and season
  • Print or view as PDF

Z report: daily closing

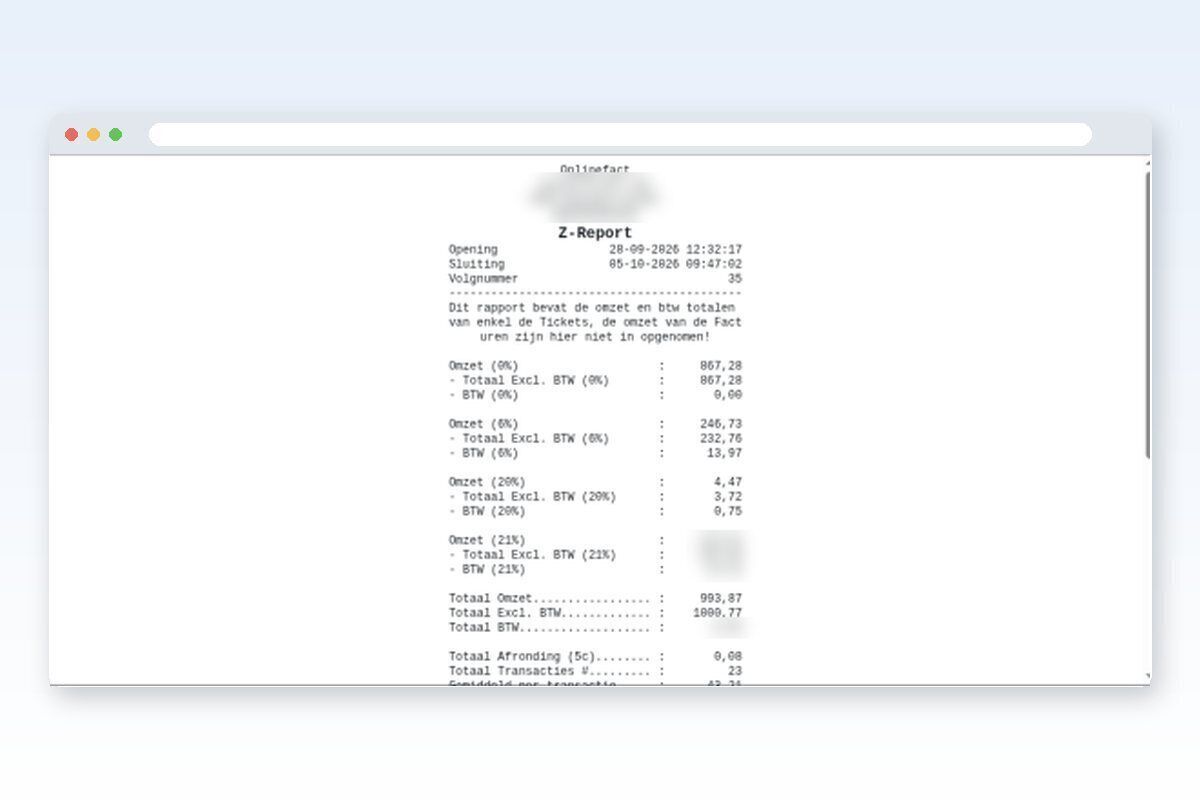
The Z report closes your till period. It shows revenue per VAT rate, excluding VAT and the VAT itself, the total, rounding to 5 cents, the number of transactions and the average per transaction. A Z report gets a sequence number and cannot be changed afterwards. Previous Z reports are kept in a list.

Real-life example: At 6 pm the assistant runs the Z report. She sees 23 transactions and the total per VAT rate, and files it with the day's takings for the accountant.

  • Revenue and VAT per rate
  • Rounding, number of transactions and average
  • Sequence number, cannot be changed
  • List of previous Z reports

X report: the interim view

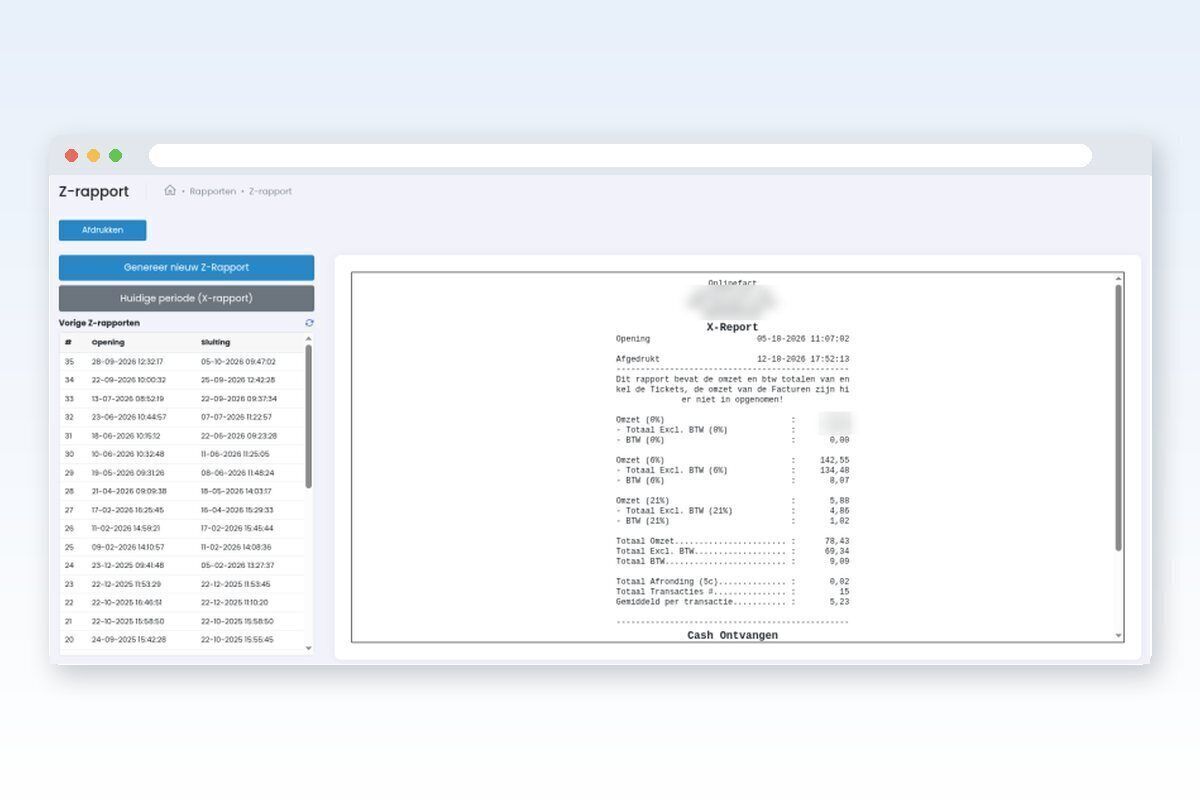
Want to know how the day is going without closing? The X report shows the same data as the Z report, but for the current period. Run it as often as you like.

Real-life example: At the 1 pm shift change, the manager checks the X report. She knows what was sold in the morning without closing the day.

  • Current period, without closing
  • Same layout as the Z report
  • As often as you like

Working with the reports

A routine in four steps.

  1. Every day
    Close the till with the Z report and check the cash in Till cash details.
  2. Every week
    Open To order and turn the selection into supplier orders.
  3. Every month
    Check monthly revenue and export it to Excel for your accountant.
  4. Every season
    Compare sales per product and sell-through per brand before your next purchase.
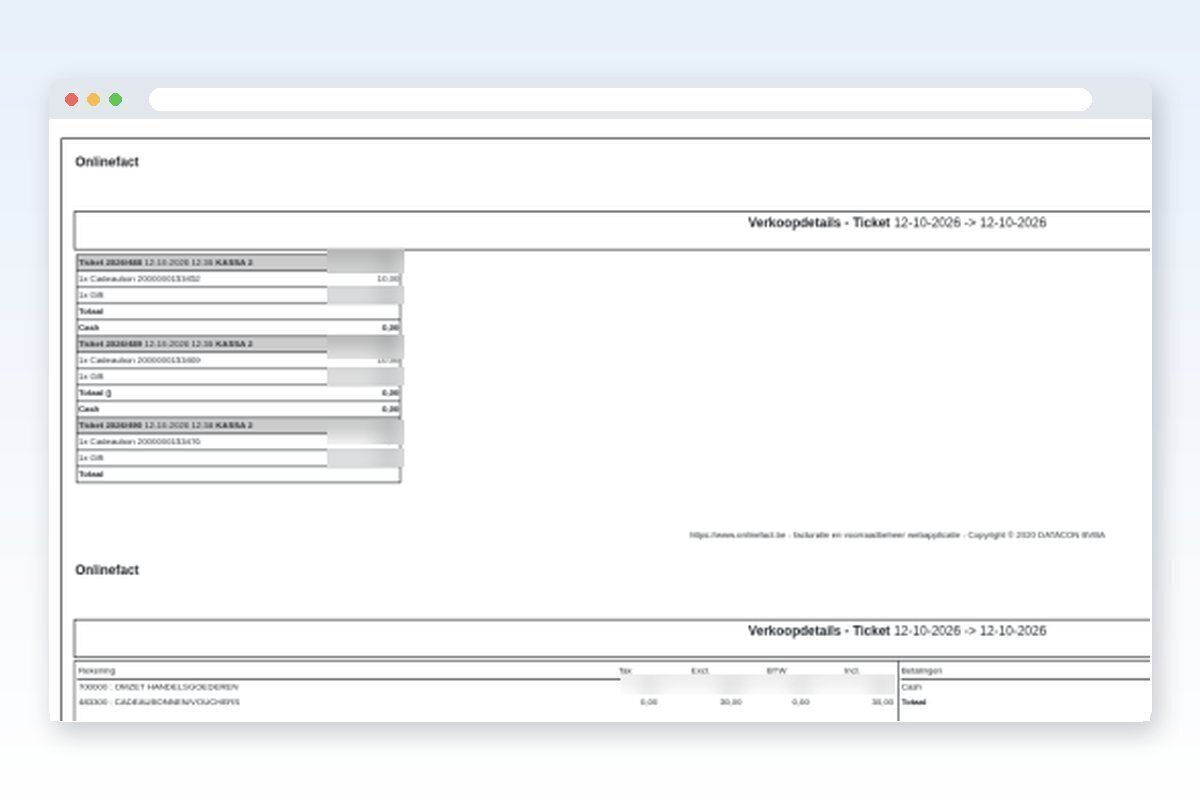
Sales details: every receipt traceable

Sales details shows every receipt with its lines, the till, the payments and the discounts. Below that you see totals per ledger account, per category and VAT rate, per payment method and per cashier. Ideal for quickly answering a question from a customer or your accountant.

Real-life example: A customer says he paid twice yesterday. In sales details you look up yesterday's receipts and see straight away what happened.

  • Every receipt with lines and payments
  • Totals per ledger account, category and VAT
  • Per payment method and per cashier
  • Discounts visible

Monthly revenue: revenue per day

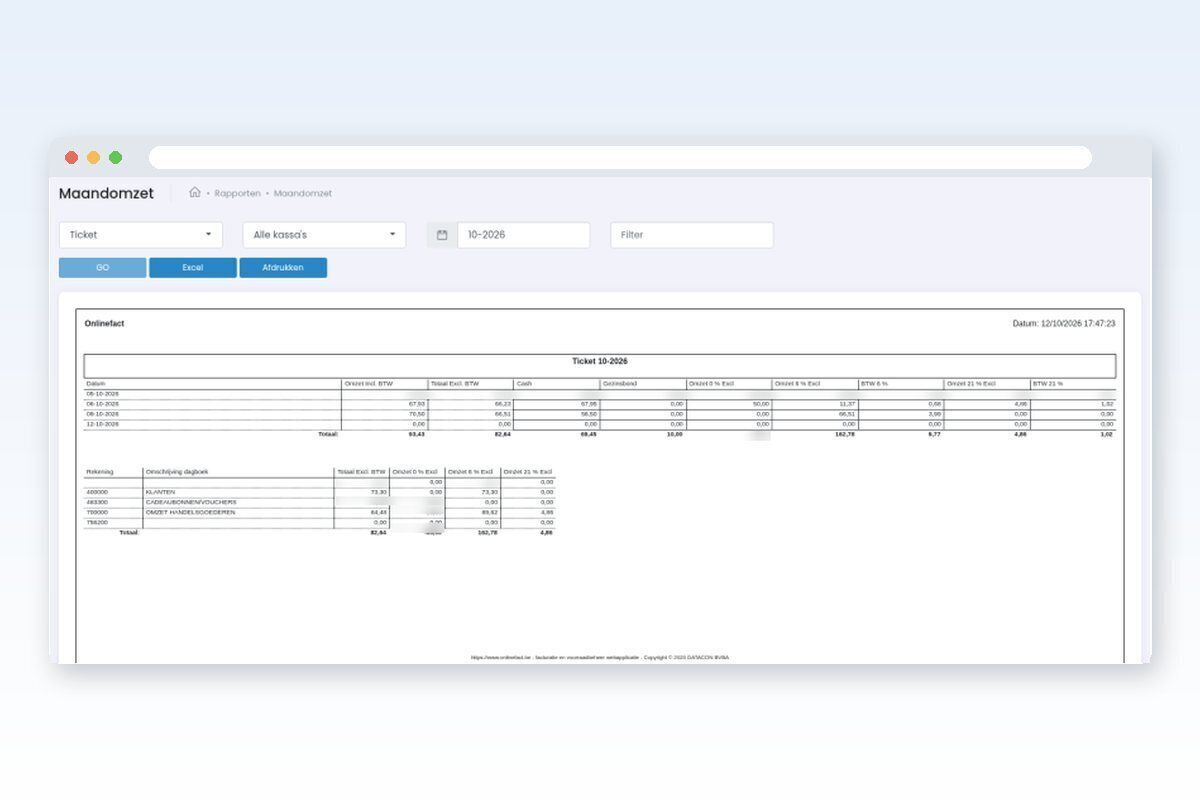
Monthly revenue shows revenue per day including and excluding VAT, split by payment method and VAT rate. At the bottom is a summary per account from your journal. Choose the month and optionally a till.

Real-life example: An accountant asks for October's revenue per VAT rate. You open monthly revenue, click Excel and send the file.

  • Revenue incl. and excl. VAT per day
  • Per payment method and VAT rate
  • Summary per account
  • Per till or all tills

More about invoicing

Which report answers your question?

An overview of the main reports.

Your questionReport
How much did I sell today?X report or Z report
Does the cash in my drawer add up?Till cash details
What was on that receipt?Sales details
What is my revenue per VAT rate this month?Monthly revenue
Which products sell best?Sales per product
What do I need to reorder?To order
What is my stock worth?Stock count
Which brands and sizes do well?Sell-through per brand
How many gift cards are open?Gift cards

Sales per product

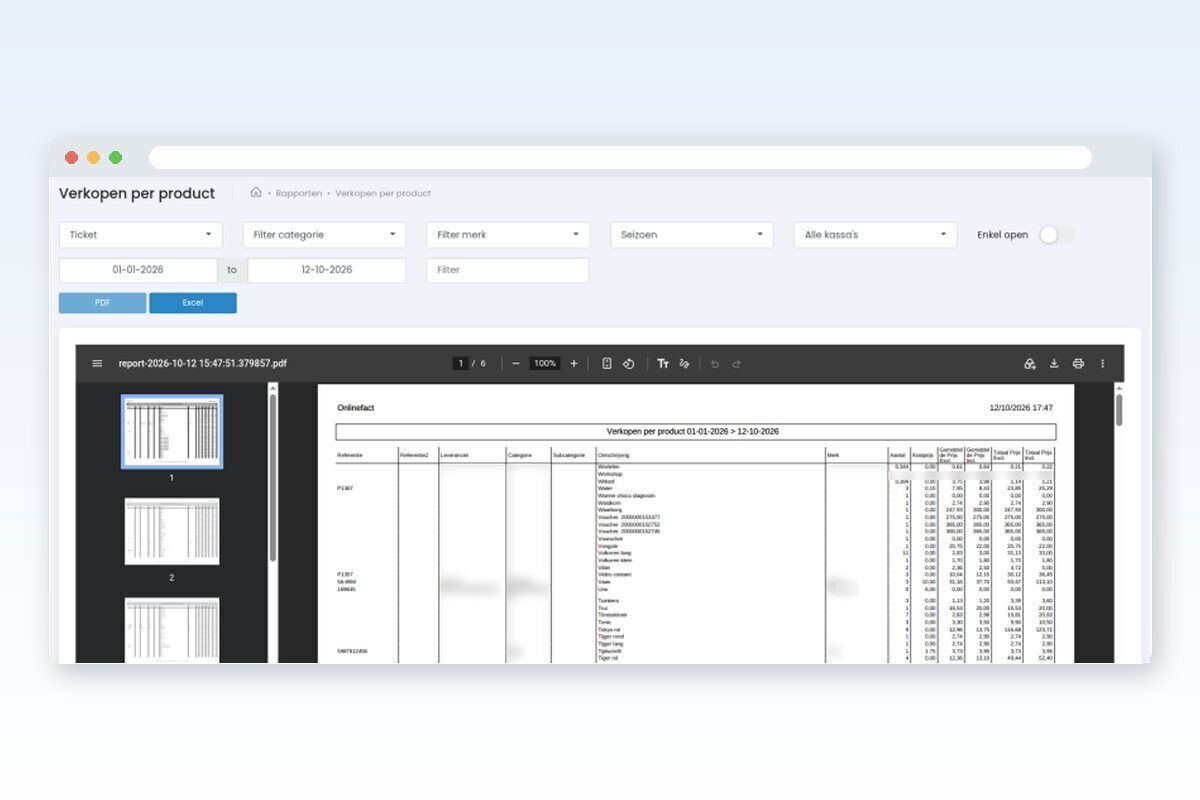
Which products sell best? This report shows per product the reference, category, brand, quantity sold, cost price, average selling price and totals. Filter by category, brand, season or till.

Real-life example: After the summer a garden centre checks which products earned the most and which hardly sold, and adjusts next year's orders.

  • Quantity, cost price and average price per product
  • Totals incl. and excl. VAT
  • Filters for category, brand, season and till

To order

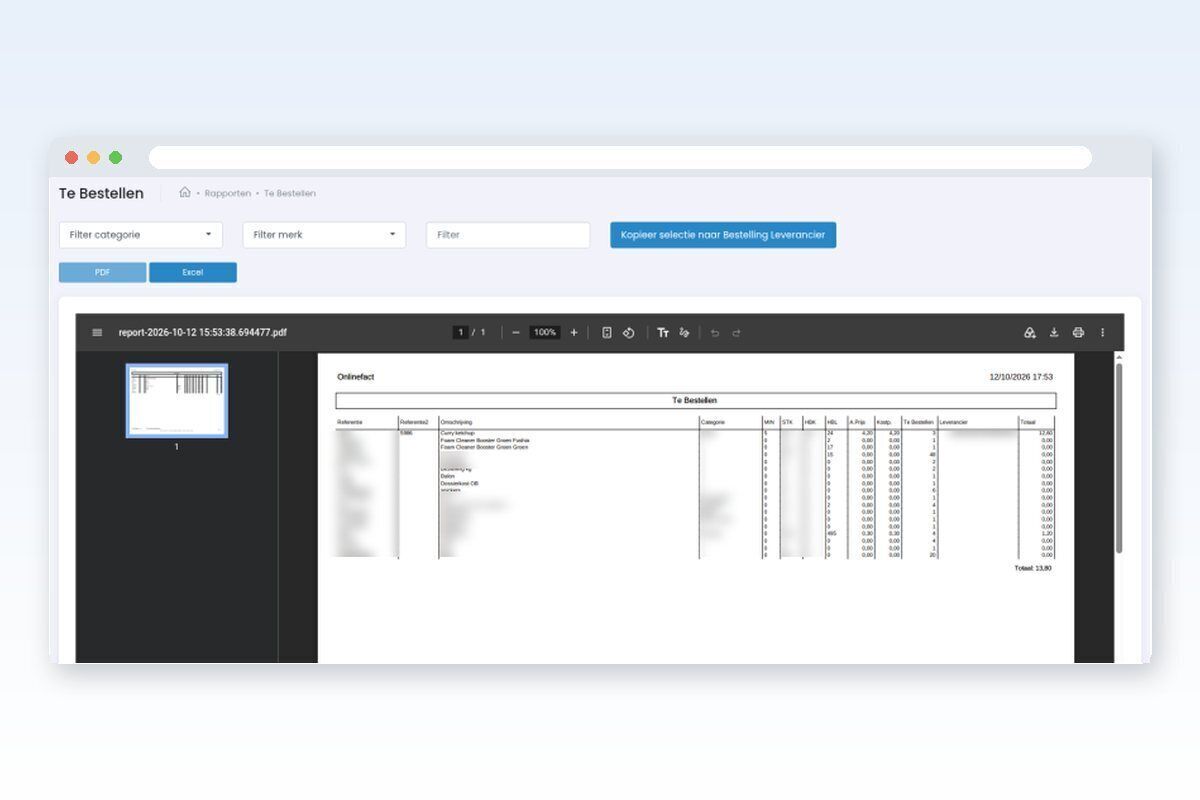
This report shows which products are below their minimum stock, with current stock, the quantity to order and the supplier. You can copy the selection straight into a supplier order.

Real-life example: Every Friday a convenience store opens the To order report, filters by supplier and turns the selection into an order.

  • Minimum stock, stock and quantity to order
  • Supplier per product
  • Copy the selection into a supplier order

More about retail and stock

Stock count and stock value

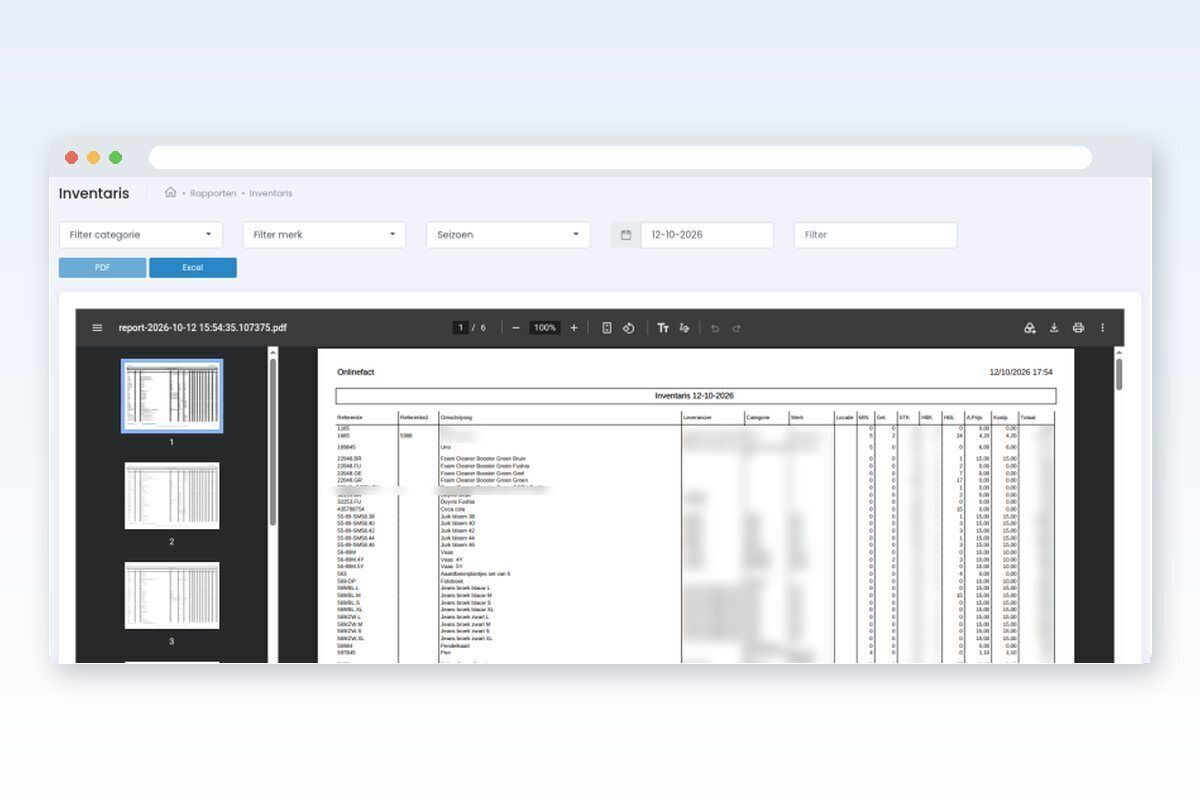
The stock report shows stock, purchase price and stock value per product, with category, brand, supplier and location. You choose a date, so you can also get the stock at the end of the financial year.

Real-life example: On 31 December the accountant asks for the stock value. The owner picks the date, exports to Excel and is done.

  • Stock and value per product
  • On a date you choose
  • Filters for category, brand and season

Sell-through per brand

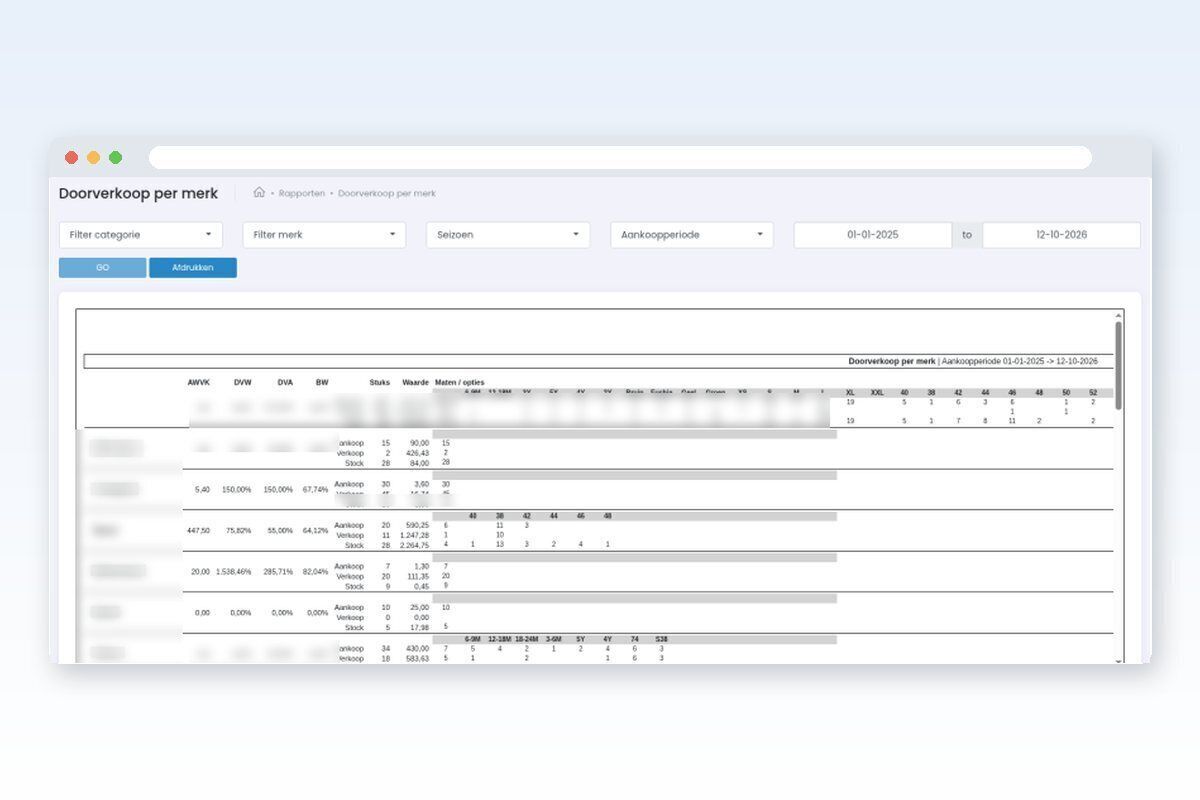
How much did you buy of a brand, how much sold and what is left? Sell-through per brand shows it per brand and even per size or option, so you see which brands and sizes do well.

Real-life example: A clothing store sees that for one brand mostly the small sizes sold, while large sizes stayed on the rack. She adjusts the split for the next purchase.

  • Purchases, sales and stock per brand
  • Per size or option
  • Filters for category, season and purchase period

Till cash details

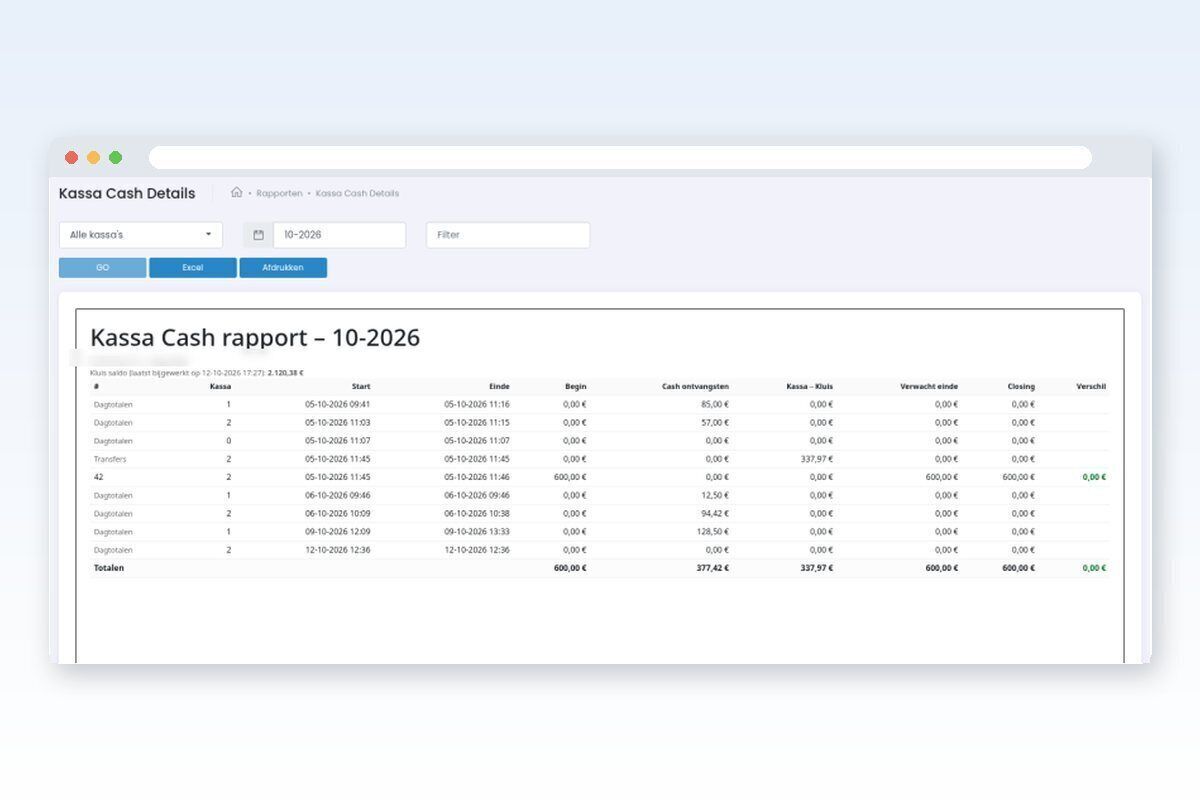
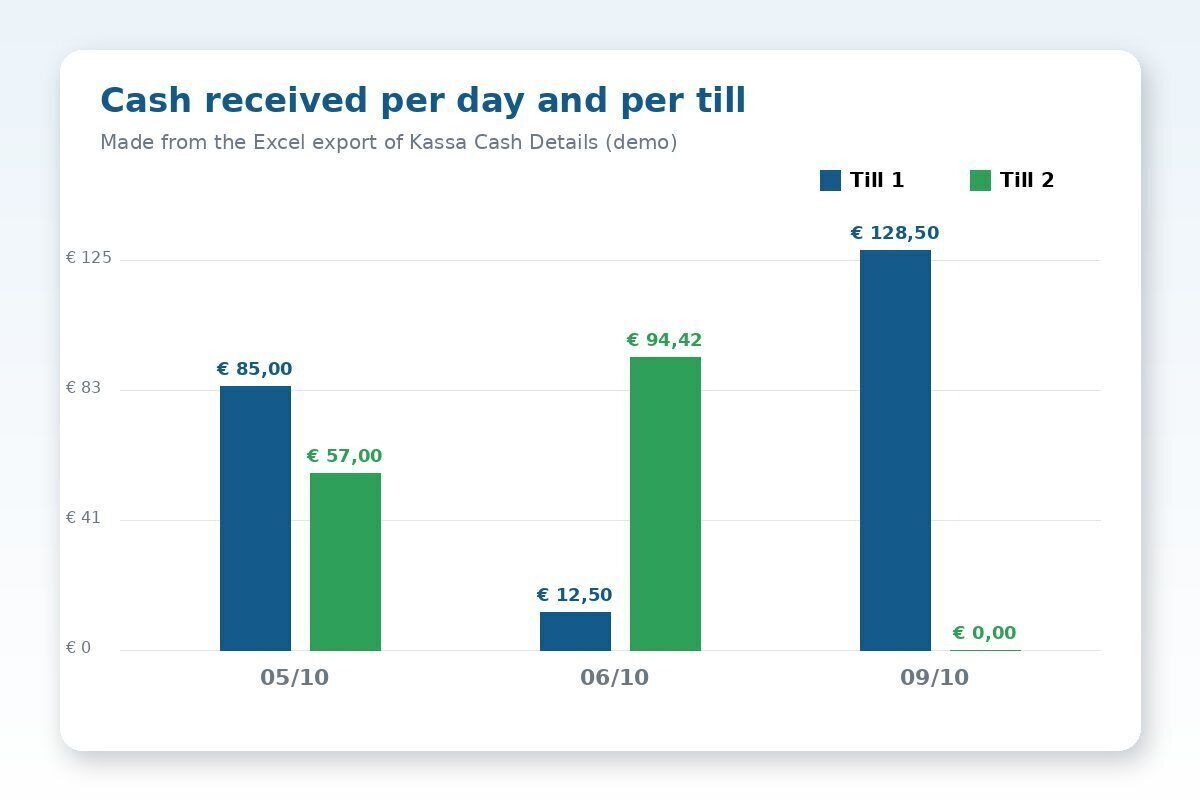
Does the cash in your drawer add up? This report shows per till and per day the opening amount, cash received, what went to the safe, the expected closing amount, the count at closing and the difference. You also see the safe balance.

Real-life example: With two tills, the manager sees per till how much cash came in and whether the closing count was right.

  • Opening, cash received and expected closing per till
  • Count and difference
  • Transfers to the safe and safe balance

Gift cards

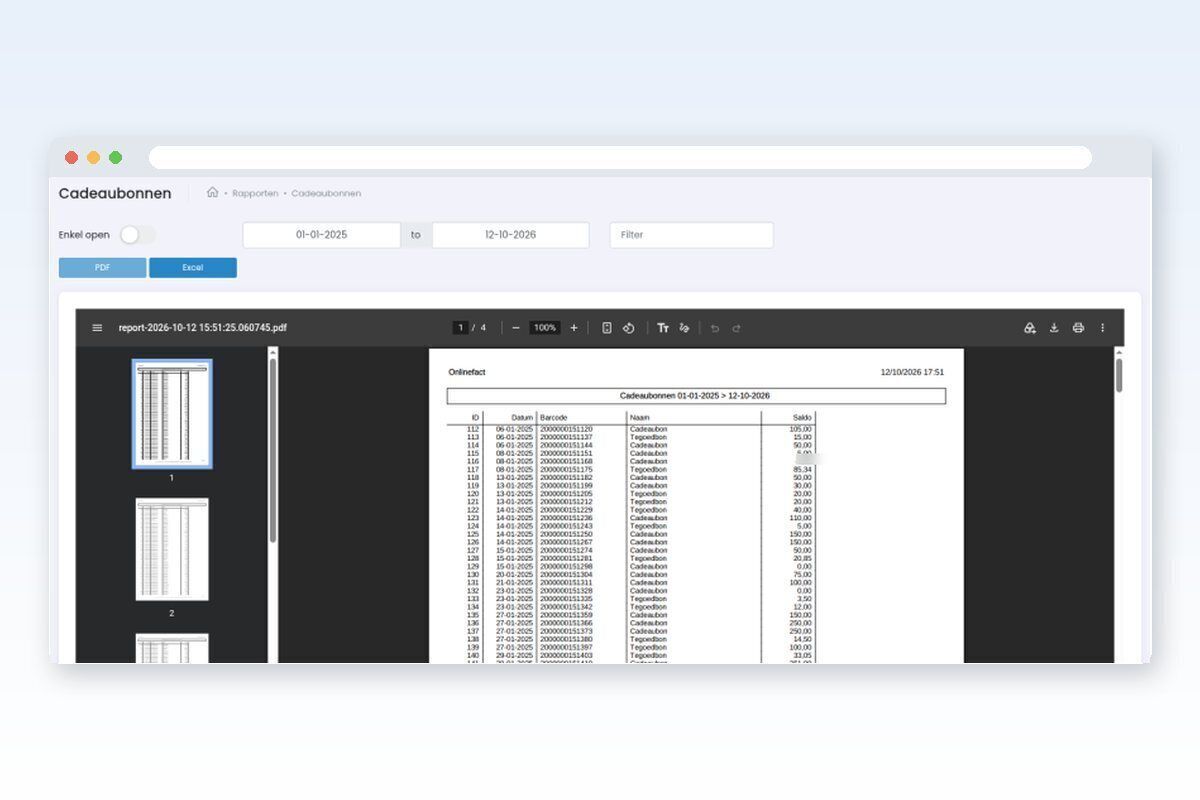
The gift card report shows every card with its barcode, type (gift card, credit note or voucher), date and open balance. One switch shows only the cards that are still open.

Real-life example: At year-end the accountant wants to know how many gift cards are still open. The report answers in one click.

  • Barcode, type and open balance
  • Show only open cards
  • Gift cards, credit notes and vouchers

More about gift cards

Export to Excel

Most reports have an Excel button. It downloads the report as a CSV file to open in Excel or another spreadsheet. Make your own charts or pass the figures to your accountant. The chart shown here was made that way from the Kassa Cash Details export.

Real-life example: A retailer exports the month's cash details and makes a chart per till in Excel, showing which days see a lot of cash.

  • Excel button on most reports
  • CSV file for Excel or another spreadsheet
  • Print or view as PDF

Your figures anywhere

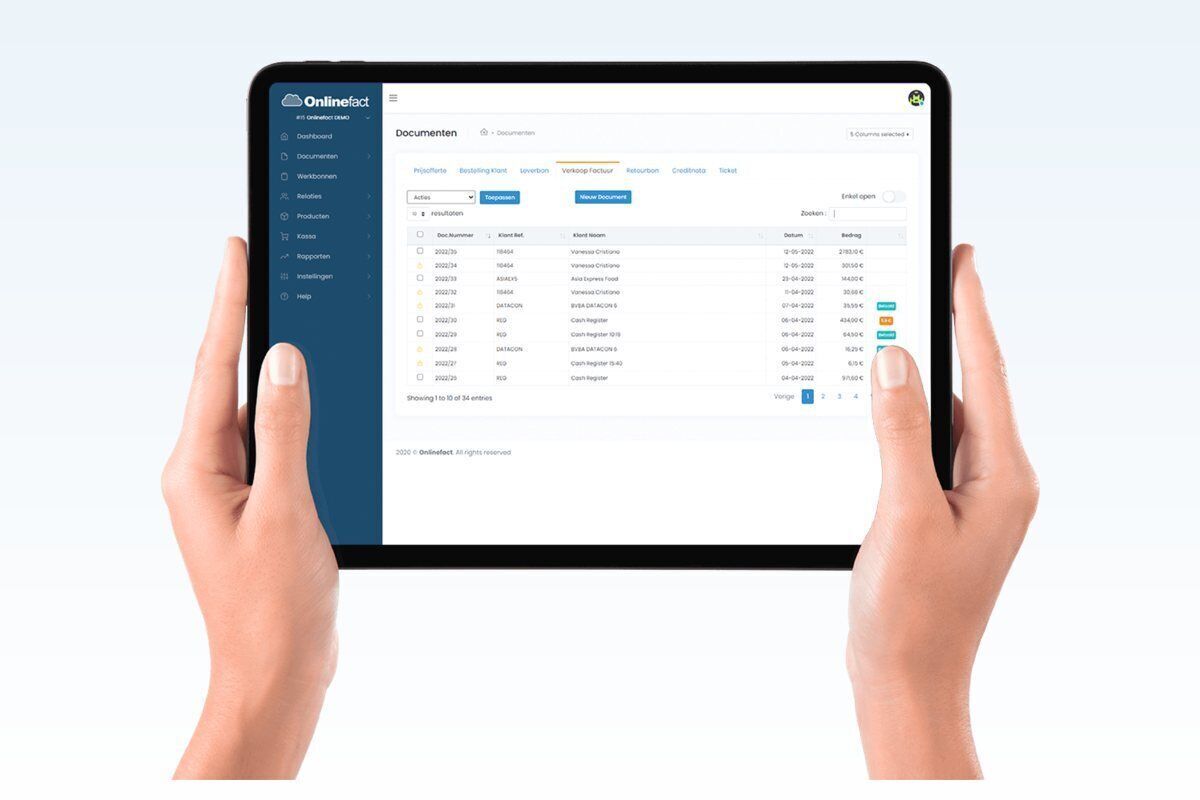
The back office runs in your browser. You don't need to be in the shop to see your reports: at home, on the road or on holiday, you see how things are going. Want the figures in your own dashboard? Fetch them via the API.

Real-life example: On a Saturday afternoon an owner checks the day's interim figures on his tablet at home.

  • Back office in the browser
  • On computer, laptop or tablet
  • Reports via the API too

More about the API

Frequently asked questions

Can I see my reports from home?

Yes. The back office runs in your browser, on any computer or tablet.

Can I change a Z report afterwards?

No. A Z report gets a sequence number and is final.

How do I pass my figures to my accountant?

Export the report to Excel, or have the accounting export sent automatically every day.

Can I print a report?

Yes. You can print any report or view it as PDF.

Want to see the reports in action?

We'd be happy to show you in a short demo which figures Onlinefact prepares for your shop.

Prefer to call? Call us on +32 78 70 02 02.

Contact us

Several stores? See franchise and multiple stores

Request Demo
Request Information